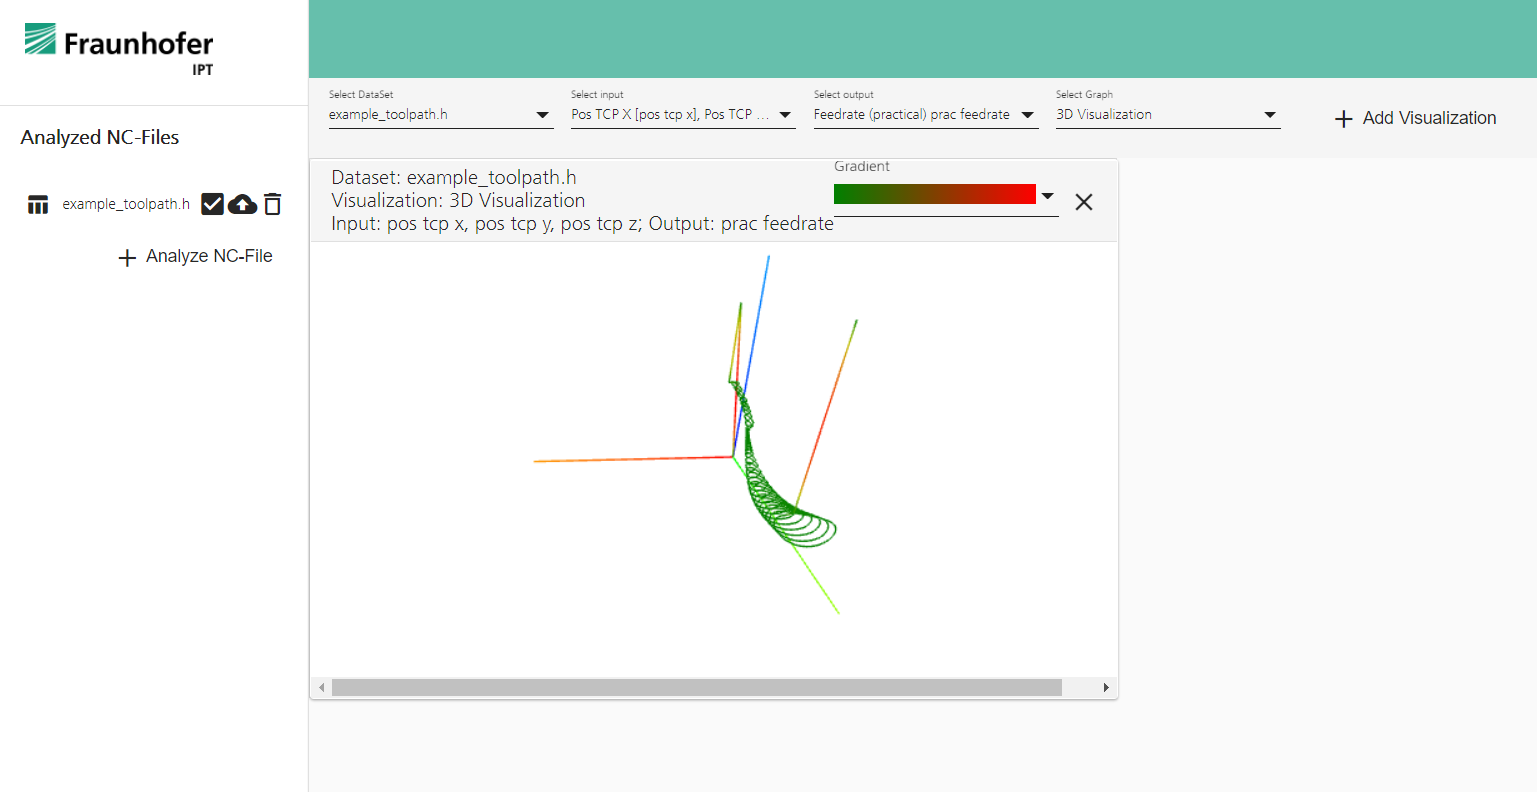
The NCProfiler Digital Service simulates the NC toolpath of a machine tool. One feature is the estimation of the real feedrate, which helps to identify critical areas. The service supports NC files in format "Sinumeric" or "Heidenhain".
| Topic Fields | |
| Published | 2019 |
| Involved Institutes | |
| Project Type | Fraunhofer Project |
| Responsibles |
This digital service "NC Data Analytics" is just a preview of our extensive application "NCProfiler" for analyzing NC files. The main features of the software are:
Contact us to get in touch! With a membership, you’ll gain full access to all project information and updates.
© Fraunhofer 2026